Every day, people produce and consume an incredible ammount of information. Just to mention an example, in one minute, TikTok users watch around 147 million videos.
At Pragma, we are no strangers to this. We seek new ways to understand people's behavior and design more personalized digital strategies.
In this article, I will show two modes of data analysis that give us profound knowledge of what happens with our users on the Internet and can be crussial for companies trying to achive their goals.
What is Cross-Selling and What are Its Advantages
Let's imagine we ran out of eggs for breakfast, so we must go to the nearest market to get them.
Now, while we are at the supermarket, there is a high probability that, in addition to the eggs, we will decide to buy cheese, butter, and bread, which are the usual companions of the egg during the first meal.
Well, the relationship between this set of products refers to what is known as complementary products, i.e., when one is purchased, it is frequent that the others also find their way into the shopping kart.
Other examples are a bathing suit and sunscreen or milk and cereal. In these cases, an excellent strategy to increase sales is to show the complementary product when the user buys one of the two, i.e., offer the milk when the cereal is purchased.
This applies in various fields of the economy, not only in physical products but also in digital ones such as educational content, music, etc.
In business, this is known as cross-selling. However, a couple of questions arise regarding this topic:
How do I identify what is the cross-selling of my products?
It is necessary to point out that for a cross-selling exercise, you must have at least a database containing an identifier of the user, the product purchased, and the date of purchase.
Well, let's imagine a retail company that registers approximately 500 purchases per day on its website. This situation adds up to about 15,000 purchases per month with very different combinations of products.
From this information, we define all the combinations of sets with products that are purchased simultaneously (it does not mean that they are necessarily complementary); among these sets, we find the following, with the respective frequency and probability of occurrence:
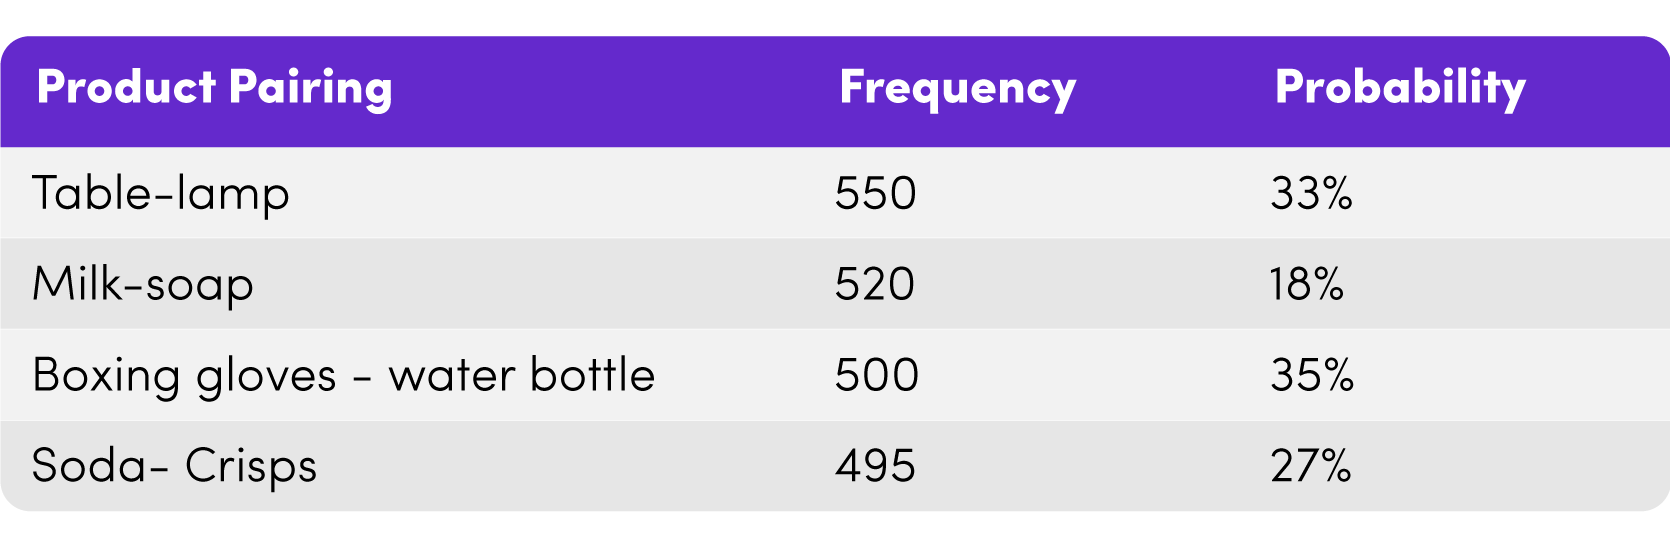
When analyzing the different sets, we can identify three distinct groups:
Obvious set: refers to a group of products with a pronounced relationship. Usually, they do not represent a significant finding but should not be overlooked. The fourth set is a sample of these.
Strange set: at first glance, they look inexplicable as the products do not seem to complement each other. Their origin may be a mere coincidence, so they are often unreliable to strategize based on them. Milk and soap are an example.
Actionable set: They are neither obvious nor strange. The products in this group are not purely the result of chance or the daily purchases of users. Therefore, they are worth analyzing. Here we can find such sets as first and third place in the table.
How useful is it to employ a cross-selling strategy?
At this point, we know that when a user buys boxing gloves, they usually acquire a water bottle. From this knowledge, we can infer the existence of users who will start attending boxing classes, which require hydration and probably an item to absorb sweat.
Based on this information, businesses can decide a route of action, but this will depend on their capacity in terms of technological development:
Real-time recommendation: the moment a user purchases boxing gloves, a message will automatically pop up recommending the purchase of a water bottle.
How to Implement Mailing Strategies
By this, we refer to a less automated approach. First, a periodicity is defined (at the beginning of each day, for example). Then, it is necessary to identify the users who purchased boxing gloves the previous day and send a predesigned email inviting the user to buy a water bottle.
This way, the data acquired during purchase allows us to understand users' preferences and improve sales.
4. Think long term
Don’t look for people to put out today’s fires. Whenever you form a team, think about the people who can rise to the challenges ahead.
Now, no one has the secret to knowing what the future holds exactly, but if you build from the minimum viable version of your team, you can safely scale it up in size with an eye on what is coming for your business.
Cohort analysis
As in the case of cross-selling, it is necessary to have a database with minimum variables such as unique identifier per user, date of registration or subscription on our website, and purchase over several months.
Let's consider the case where we want to know the monthly behavior of the users who subscribe to our website and its relation to sales.
In January of this year, 300 users registered on our portal. But we want to identify how many made at least one purchase each month. That is, how many bought at least one product in February, how many in March, and so on.
Using cohort analysis, we can identify the frequency of a given action over time.
Visually, a cohort analysis is illustrated in the image below:
Each row refers to a month in 2017, between January and June, while the columns, except the second one ("0" column with values expressed in absolute numbers), indicate the behavior in subsequent months concerning each row.
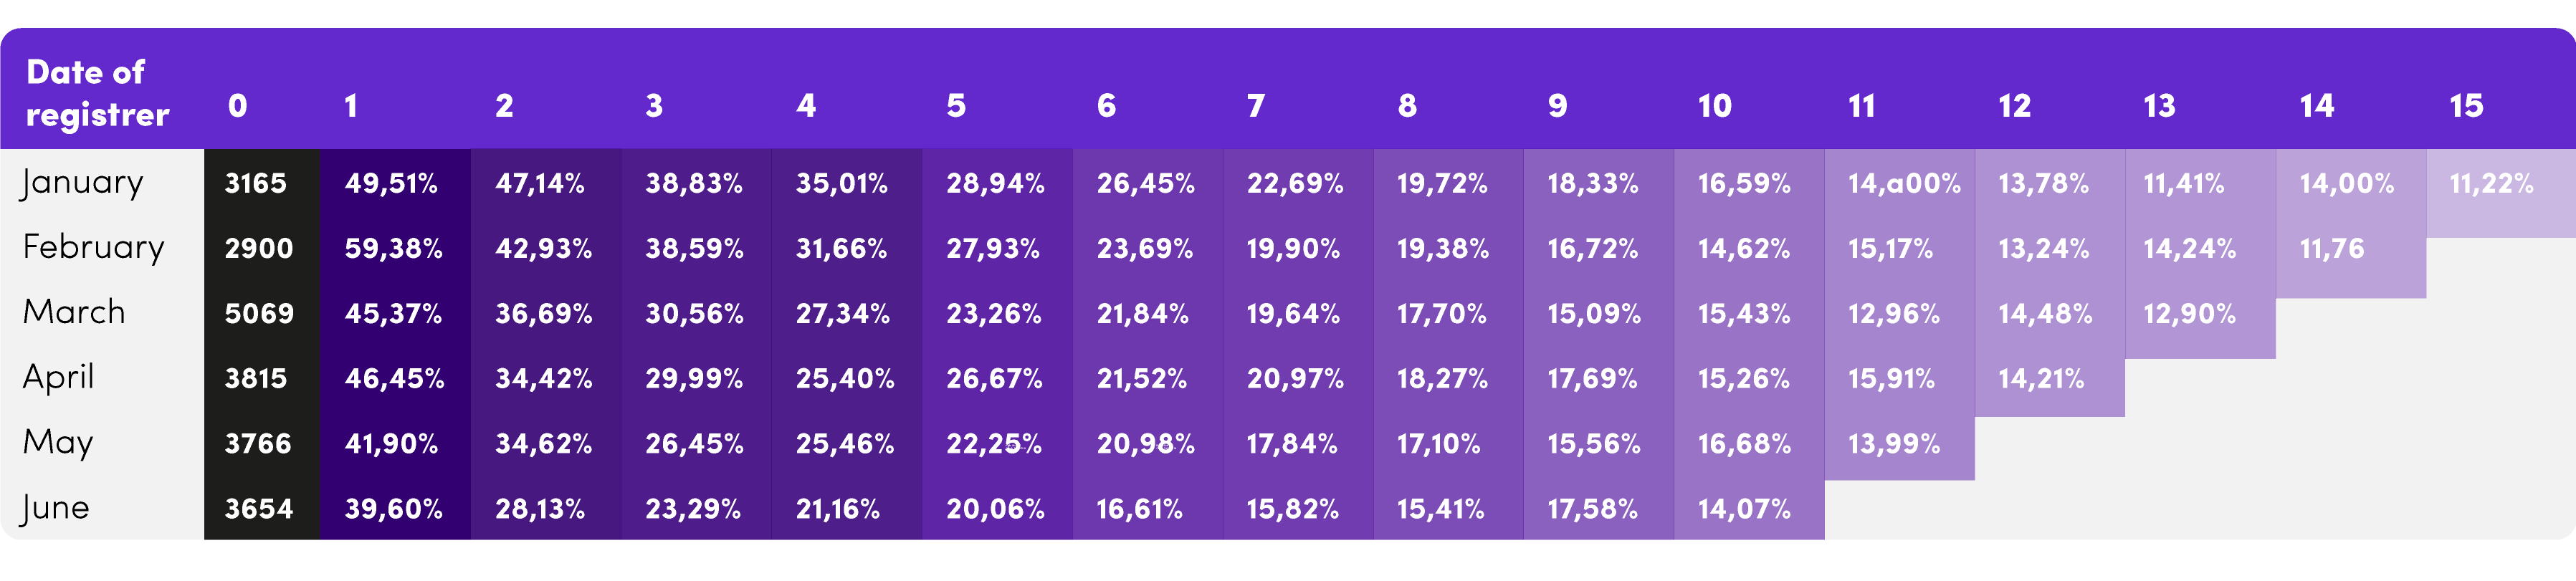
For example, let's focus on January, where we can see that in the second column ("0"). There is a value of 3,165, which indicates the number of individuals subscribed to the portal that month. Then, in column "1" there is a value of 49.51%, which means that 49.51% of the people registered in January made a purchase in the following month. That is to say: in February, column "2" represents what happened in March; column "3", in April, and so on.
Therefore, if we analyze the month of May, in column "5", we can say that, of the 3,766 people registered in that month, only 22.25% made a purchase in the fifth month (October).
What is the use of this information?
We can think of different ways to take advantage of this information:
User life cycle: with this tool, it is possible to determine with greater accuracy what our users' life cycle (measured in months) is, both at a general level and discriminated by month. Thus, for example, we can determine that users who register in January remain with the company for 15 months, while those who join in August do so for only nine months.
Find out best months to carry out subscription strategies: related to the previous point, the cohort analysis allows us to identify the months where it is more profitable to get new users, which will be in the months where in the long term, the conversion rate is higher.
Particular situations: we can identify atypical cases that provide unknown realities. For example, those registered in March always increase their sales the following month, while those in other months remain constant; therefore, we must determine what differentiates these individuals from others.
However, the usefulness is not limited to these three cases. Data analysis needs to meet with strategic thinking to obtain significant benefits. When you identify the company's needs and analyze the data provided by our websites, your organization is a step closer to implementing creative strategies to reach your business goals.
Share this

AWS Textract: this is how we used it to speed up document processing

Service Personalization for Small Banks: Five Key Benefits

Outsourcing: four strategies to stay stable in a crisis